As a former Deputy Public Defender in Riverside County, Mr. Donath has always been on the defense side of the law.
award winning certified criminal law specialist
Top 100 Trial Attorneys in California 2012-2014, 2008 Trial Attorney of the Year by the Riverside County Public Defender's Office, and dozens of other awards and accolades.
a true passion for defending the accused
Your lawyer should have a passion for defense, not just a passion for money. Reputation, vigor, and determination go a long way in this business.
former deputy public defender
As a former Deputy Public Defender in Riverside County, Mr. Donath has always been on the defense side of the law.
award winning certified criminal law specialist
Top 100 Trial Attorneys in California 2012-2014, 2008 Trial Attorney of the Year by the Riverside County Public Defender's Office, and dozens of other awards and accolades.
a true passion for defending the accused
Your lawyer should have a passion for defense, not just a passion for money. Reputation, vigor, and determination go a long way in this business.
What city in California is the most dangerous? Which city is the safest? When looking at the crime numbers in the state, most people would assume that Oakland is the most dangerous city in California.
However, using crime statistics alone to determine a city’s level of danger or safety is something that criminologists and the FBI warn against. There are a myriad of other factors that combine to affect crime and public safety in a city. Together- Riverside criminal defense attorney Graham Donath and data visualization firm 1point21 Interactive, we analyzed several of these factors along with the latest crime data from the FBI to find out which cities in California with a population of 100,000 or greater are the most dangerous in the state.
Overall Rankings
We analyzed data across three key dimensions – Crime, Police Presence, and Community Factors. Within these dimensions, we identified and ranked 14 metrics that influence the safety of a city. The table below displays the results of our study.
Final Rank
City
Crime Rank (1 is Most Crime)
Police Rank (1 is Least Investment)
Community Rank (1 is Highest Risk Factors)
Overall Score
1
San Bernardino
2
9
9
37.50
2
Stockton
3
40
2
65.50
3
Modesto
8
10
7
80.50
4
Vallejo
4
8
32
86.00
5
Salinas
10
3
11
94.50
6
Oakland
1
53
26
99.50
7
Antioch
6
4
34
100.00
8
Pomona
11
22
5
112.00
9
Victorville
14
1
16
130.00
10
Inglewood
9
54
12
139.50
11
Richmond
5
58
38
152.50
12
Sacramento
13
30
20
157.50
13
Lancaster
17
13
23
175.00
14
San Francisco
7
61
48
185.50
15
Riverside
15
38
24
186.50
16
Fairfield
12
31
49
194.50
17
Long Beach
19
36
14
199.50
18
Santa Maria
20
19
25
206.50
19
Los Angeles
18
63
8
210.00
20
Fresno
21
47
4
210.50
21
Santa Ana
26
15
3
214.50
22
Bakersfield
24
12
17
217.50
23
Visalia
23
18
21
222.00
24
Hayward
16
49
41
230.50
25
Oxnard
22
33
33
247.50
26
Rialto
33
17
6
273.50
27
Santa Rosa
30
20
39
303.50
28
Anaheim
31
48
19
309.00
29
El Cajon
34
46
10
316.00
30
San Jose
29
35
43
317.00
31
Berkeley
25
64
46
320.50
32
Oceanside
27
45
53
327.00
33
Fontana
41
5
13
332.00
34
Escondido
36
21
31
337.50
35
Concord
28
55
51
341.50
36
El Monte
44
16
1
347.50
37
Downey
42
29
15
366.50
38
Pasadena
35
66
29
372.00
39
San Diego
32
59
52
377.00
40
Elk Grove
38
2
60
377.00
41
Clovis
43
14
30
381.50
42
Costa Mesa
37
44
44
387.50
43
Ontario
40
62
22
395.00
44
Garden Grove
47
26
18
405.50
45
Chula Vista
46
7
36
406.00
46
Ventura
39
52
47
415.00
47
Fullerton
45
37
37
430.00
48
West Covina
50
25
27
440.50
49
Rancho Cucamonga
53
11
55
491.00
50
Huntington Beach
48
56
62
509.00
51
San Mateo
49
51
64
514.50
52
Daly City
52
43
57
518.50
53
Santa Clara
51
60
59
531.00
54
Burbank
54
67
42
535.00
55
Corona
59
42
35
537.00
56
Temecula
57
32
54
540.50
57
Roseville
55
39
63
546.00
58
Santa Clarita
64
6
40
546.00
59
Carlsbad
56
41
67
561.50
60
Simi Valley
60
34
58
571.00
61
Torrance
58
68
50
578.00
62
Fremont
61
28
68
587.50
63
Thousand Oaks
63
24
66
595.50
64
Murrieta
66
23
56
602.00
65
Sunnyvale
62
50
61
606.50
66
Glendale
67
65
28
609.50
67
Orange
65
57
45
612.00
68
Irvine
68
27
65
634.50
*for more information on our ranking formula, see our methodology section
Crime and Public Safety
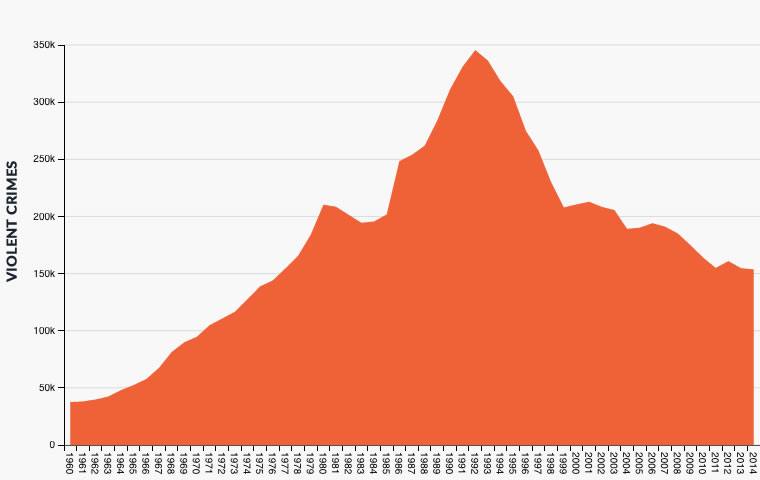
In the state of California, there were a total of 1,105,242 crimes (2,848 crimes per 100,000 people) committed in 2014;. 151,425 of these were what classified as violent crimes. Violent crime, as defined by the FBI, includes instances of murder and non-negligent manslaughter, forcible rape, robbery, and aggravated assault, all of which involve felony charges. Weighed heaviest in our rankings, violent crime had the biggest impact on public safety. By it’s nature, violent crime threatens citizen’s personal safety and even their lives. At the state level, violent crime rates were down compared to 2013 in nearly every category. This continues a downward (but very positive) trend in the reduction of reported violent crimes over the past 22 years – where it peaked at 345,508 in 1992 .
While overall violent crime is decreasing, it remains high and is rising in several cities in the state. Interestingly, violent crime in the state’s biggest city, Los Angeles, has decreased significantly while it has risen sharply in others – Oakland for example. As previously mentioned, there are many variables that affect crime differently in every city.
Crime Rates in the 10 Largest Cities in California
Looking at the largest cities by population, Oakland stands head and shoulders above the rest, with more than 2X the crime rate of San Francisco and more than 3X of Los Angeles.
Crime - Detailed Findings (Crime Data Displayed as Rate Per 100k)
Final Rank
City
Violent Crime
Murder
Rape
Robbery
Assault
Total Crime
Crime Totals
Crime Rank
1
San Bernardino
991.67
20.04
48.46
377.93
545.23
10,650.18
20.00
2.00
2
Stockton
1,331.47
16.36
44.74
366.59
903.78
11,467.72
21.00
3.00
3
Modesto
863.86
5.34
39.35
187.06
632.11
10,611.70
60.00
8.00
4
Vallejo
865.24
15.06
52.72
307.94
489.52
9,931.89
29.00
4.00
5
Salinas
635.40
9.56
20.39
286.15
319.30
7,956.25
92.00
10.00
6
Oakland
1,685.39
19.51
50.98
849.04
765.86
15,300.22
10.00
1.00
7
Antioch
784.49
8.32
49.90
295.69
430.59
9,351.99
44.00
6.00
8
Pomona
511.52
11.85
28.97
158.66
312.05
6,831.51
96.00
11.00
9
Victorville
524.87
2.45
31.88
154.52
336.01
8,222.15
112.00
14.00
10
Inglewood
699.13
17.86
28.57
331.26
321.44
6,306.42
80.00
9.00
11
Richmond
777.22
10.14
58.08
348.50
360.49
9,473.19
38.00
5.00
12
Sacramento
614.79
5.80
16.16
207.14
385.69
7,511.08
109.00
13.00
13
Lancaster
556.21
2.50
33.71
155.44
364.57
5,706.35
122.00
17.00
14
San Francisco
795.14
5.29
41.75
379.16
368.93
12,225.07
47.00
7.00
15
Riverside
433.24
3.76
44.76
138.05
246.67
7,069.58
119.00
15.00
16
Fairfield
470.53
5.44
37.17
182.23
245.69
7,972.80
101.00
12.00
17
Long Beach
489.04
4.88
23.35
188.70
272.12
6,274.79
126.00
19.00
18
Santa Maria
426.69
2.92
42.77
144.82
236.19
6,783.30
130.00
20.00
19
Los Angeles
490.71
6.66
28.82
203.47
251.77
5,266.68
122.00
18.00
20
Fresno
464.16
9.16
10.33
152.19
292.49
9,202.30
131.00
21.00
21
Santa Ana
374.49
5.35
34.18
134.34
200.62
4,193.34
172.00
26.00
22
Bakersfield
456.72
4.63
5.72
179.64
266.73
8,959.57
154.00
24.00
23
Visalia
376.69
7.78
23.35
107.40
238.15
6,666.77
148.00
23.00
24
Hayward
394.60
5.87
34.57
214.59
139.58
7,168.71
121.00
16.00
25
Oxnard
433.00
5.39
22.04
218.95
186.62
7,131.21
133.00
22.00
26
Rialto
319.88
4.88
17.55
110.20
187.24
4,849.81
205.00
33.00
27
Santa Rosa
367.65
1.16
40.46
75.15
250.88
5,210.68
189.00
30.00
28
Anaheim
317.33
4.04
22.77
120.48
170.05
5,365.81
190.00
31.00
29
El Cajon
317.98
3.89
19.45
130.30
164.34
5,023.43
205.00
34.00
30
San Jose
321.09
3.17
30.31
106.17
181.44
5,522.65
184.00
29.00
31
Berkeley
366.02
2.55
29.72
223.35
110.40
9,410.38
155.00
25.00
32
Oceanside
374.49
2.87
29.87
106.83
234.92
5,345.14
174.00
27.00
33
Fontana
347.13
0.98
19.07
84.58
242.50
4,328.42
238.00
41.00
34
Escondido
341.70
2.00
23.36
110.12
206.22
4,731.08
207.00
36.00
35
Concord
366.88
2.37
17.36
130.97
216.18
8,939.28
177.00
28.00
36
El Monte
286.53
1.72
17.21
141.11
126.48
4,385.65
247.00
44.00
37
Downey
247.37
2.64
13.20
111.80
119.72
5,607.64
239.00
42.00
38
Pasadena
280.68
7.12
16.38
89.76
167.41
5,523.85
205.00
35.00
39
San Diego
380.95
2.34
27.11
96.30
255.21
4,695.07
192.00
32.00
40
Elk Grove
381.70
1.23
19.64
76.09
284.74
4,536.78
216.00
38.00
41
Clovis
214.49
0.99
27.80
47.66
138.03
6,525.99
243.00
43.00
42
Costa Mesa
282.14
0.00
39.93
106.47
135.75
6,723.51
209.00
37.00
43
Ontario
256.12
3.57
11.89
96.86
143.81
6,061.40
226.00
40.00
44
Garden Grove
230.54
2.84
9.65
70.41
147.64
3,993.05
278.00
47.00
45
Chula Vista
235.48
2.69
15.39
82.34
135.06
3,965.85
266.00
46.00
46
Ventura
252.64
0.92
25.63
94.28
131.81
7,593.87
220.00
39.00
47
Fullerton
242.32
0.00
39.32
72.20
130.81
5,085.96
251.00
45.00
48
West Covina
208.07
0.92
3.70
80.45
122.99
5,658.62
290.00
50.00
49
Rancho Cucamonga
163.87
2.32
9.84
57.33
94.39
4,584.99
304.00
53.00
50
Huntington Beach
196.33
0.50
22.60
50.21
123.02
4,658.75
289.00
48.00
51
San Mateo
225.31
0.00
20.57
72.49
132.25
4,268.14
289.00
49.00
52
Daly City
183.66
1.89
16.09
73.84
91.83
3,566.29
299.00
52.00
53
Santa Clara
133.76
0.00
21.47
73.48
38.81
5,673.17
296.00
51.00
54
Burbank
142.80
0.95
13.33
52.36
76.16
4,916.18
306.00
54.00
55
Corona
106.13
0.00
15.52
42.20
48.41
4,496.43
346.00
59.00
56
Temecula
92.33
1.85
6.46
49.86
34.16
4,872.22
338.00
57.00
57
Roseville
149.62
0.78
13.18
38.76
96.90
5,072.99
314.00
55.00
58
Santa Clarita
148.36
0.48
7.25
44.46
96.17
2,656.94
354.00
64.00
59
Carlsbad
181.66
0.89
12.47
39.18
129.12
3,450.67
325.00
56.00
60
Simi Valley
110.58
0.00
21.33
18.96
70.30
2,786.64
346.00
60.00
61
Torrance
104.75
1.35
12.16
49.33
41.90
3,757.49
338.00
58.00
62
Fremont
124.79
0.44
8.79
52.29
63.28
3,691.97
348.00
61.00
63
Thousand Oaks
99.09
0.77
19.35
17.03
61.93
2,677.76
351.00
63.00
64
Murrieta
62.74
0.92
5.54
18.45
37.83
2,828.12
380.00
66.00
65
Sunnyvale
111.79
0.67
9.37
58.91
42.84
3,387.24
351.00
62.00
66
Glendale
94.38
0.00
4.57
34.00
55.82
3,315.42
387.00
67.00
67
Orange
100.88
0.00
7.10
37.65
56.12
3,402.08
376.00
65.00
68
Irvine
49.39
0.00
11.52
14.82
23.05
2,608.54
396.00
68.00
20 Most Dangerous Cities in California
Police and Community Factors - Detailed Findings
Final Rank
City
Population
Pop. Density
Poverty Rate
Unemp. Rate
High School Grad %
Days over 80 degrees (F)
Police Budget Per Capita
Officers per 100k
28
Anaheim
346,956.00
6,961.39
15.60
5.20
72.00
143
340
107.79
100
7
Antioch
108,223.00
3,817.38
14.50
6.50
83.00
142
257
81.31
22
Bakersfield
367,406.00
2,584.45
19.30
9.20
75.30
166
210
100.71
31
Berkeley
117,753.00
11,246.70
18.10
3.60
94.40
33
516
142.67
54
Burbank
105,041.00
6,057.72
8.50
5.80
86.20
121
462
138.99
59
Carlsbad
112,297.00
2,977.12
9.70
4.30
94.30
61
257
97.95
45
Chula Vista
259,894.00
5,236.63
10.40
6.00
78.80
82
172
81.57
41
Clovis
100,705.00
4,325.81
12.10
7.90
86.00
167
142
94.33
35
Concord
126,744.00
4,148.74
11.30
5.10
85.20
124
347
119.14
55
Corona
161,128.00
4,149.57
9.90
4.80
80.10
170
255
95.58
42
Costa Mesa
112,709.00
7,201.85
14.10
4.20
84.40
29
357
100.26
52
Daly City
105,628.00
13,789.55
7.80
3.90
83.90
15
245
105.09
37
Downey
113,595.00
9,153.50
12.10
6.30
73.70
160
256
95.07
29
El Cajon
102,838.00
7,126.68
24.80
6.90
76.90
138
265
118.63
36
El Monte
116,220.00
12,156.90
22.80
8.80
53.10
159
198
98.09
40
Elk Grove
162,957.00
3,862.45
9.30
4.50
88.50
153
200
77.32
34
Escondido
149,839.00
4,070.60
18.30
4.80
71.20
137
235
102.11
16
Fairfield
110,300.00
2,949.98
12.90
5.30
83.60
128
298
101.54
33
Fontana
204,532.00
4,842.46
15.00
6.60
69.20
167
205
89.47
62
Fremont
227,575.00
2,937.96
5.80
3.50
89.10
66
253
79.53
20
Fresno
513,187.00
4,583.66
27.50
11.10
71.80
167
280
137.96
47
Fullerton
139,895.00
6,259.28
14.60
4.70
83.60
106
261
97.93
44
Garden Grove
176,106.00
9,816.38
15.50
5.10
70.80
119
260
86.31
66
Glendale
197,079.00
6,472.22
12.90
6.90
83.70
154
389
123.81
24
Hayward
153,319.00
3,383.03
13.50
6.30
76.80
37
396
114.14
50
Huntington Beach
199,152.00
7,444.93
8.30
4.00
91.50
17
317
103.94
10
Inglewood
111,997.00
12,348.07
20.10
9.30
70.20
19
425
144.65
68
Irvine
242,971.00
3,675.25
11.40
3.10
95.90
83
197
82.31
13
Lancaster
160,190.00
1,699.08
21.00
7.90
77.40
160
153
117.98
17
Long Beach
471,123.00
9,368.12
20.20
7.70
78.80
99
92
166.84
19
Los Angeles
3,906,772.00
8,335.86
21.20
7.50
72.80
120
335
253.59
3
Modesto
205,820.00
5,582.32
19.50
9.60
76.20
160
244
100.57
64
Murrieta
108,376.00
3,227.39
7.00
5.00
89.30
184
218
76.59
6
Oakland
409,994.00
7,348.87
20.30
5.50
78.20
42
461
174.39
32
Oceanside
174,102.00
4,222.70
11.80
4.90
81.70
21
297
116.60
43
Ontario
168,278.00
3,369.60
16.40
6.10
67.80
167
406
135.49
67
Orange
140,767.00
5,676.08
10.70
4.10
81.20
118
269
106.56
25
Oxnard
204,159.00
4,592.37
15.90
5.50
61.60
18
245
118.05
38
Pasadena
140,373.00
6,111.14
12.90
6.30
83.40
159
452
161.00
8
Pomona
151,899.00
6,618.69
20.40
7.90
62.80
147
277
103.36
49
Rancho Cucamonga
172,694.00
4,333.60
5.80
4.50
87.70
167
182
77.01
26
Rialto
102,540.00
4,587.92
19.20
7.30
64.40
172
243
97.52
11
Richmond
108,464.00
3,607.05
17.90
5.40
76.30
36
432
165.95
15
Riverside
319,453.00
3,937.06
17.50
5.90
75.20
163
274
113.94
57
Roseville
128,997.00
3,561.48
8.30
4.50
91.90
154
267
92.25
12
Sacramento
482,767.00
4,930.22
20.20
6.00
79.50
157
248
129.05
5
Salinas
156,908.00
6,769.11
20.80
8.00
57.10
49
223
86.04
1
San Bernardino
214,588.00
3,924.79
30.60
6.10
64.40
172
223
104.85
39
San Diego
1,368,690.00
4,208.89
15.40
4.60
84.80
61
305
137.07
14
San Francisco
850,294.00
18,141.54
13.20
3.40
84.50
0
621
251.32
30
San Jose
1,009,679.00
5,719.58
11.70
4.30
78.80
70
303
95.67
51
San Mateo
102,082.00
8,415.66
6.50
3.20
87.10
16
300
103.84
21
Santa Ana
336,462.00
12,338.17
20.70
4.70
50.40
184
308
78.46
53
Santa Clara
121,114.00
6,578.71
9.00
3.50
89.90
122
387
116.42
58
Santa Clarita
206,930.00
3,925.07
8.60
6.50
85.90
159
102
68.14
18
Santa Maria
102,885.00
4,520.43
19.80
5.60
57.40
82
228
106.92
27
Santa Rosa
172,991.00
4,189.66
13.20
4.70
82.00
148
262
95.96
60
Simi Valley
126,604.00
3,052.17
6.60
4.40
87.60
181
227
93.20
2
Stockton
299,519.00
4,856.80
23.30
9.50
70.30
173
384
123.87
65
Sunnyvale
149,384.00
6,793.27
7.20
3.40
89.60
78
180
137.23
56
Temecula
108,308.00
3,592.30
8.90
4.50
88.10
176
208
92.33
63
Thousand Oaks
129,175.00
2,347.35
6.40
4.90
92.30
106
210
83.61
61
Torrance
147,971.00
7,225.14
7.40
4.90
91.70
122
458
141.92
4
Vallejo
119,504.00
3,896.44
16.00
7.90
83.50
135
286
84.52
46
Ventura
109,246.00
5,046.00
11.50
5.10
83.00
18
280
116.25
9
Victorville
122,316.00
1,671.44
23.70
6.50
73.30
168
146
64.59
23
Visalia
128,488.00
3,544.49
17.20
9.30
79.10
166
204
108.18
48
West Covina
108,136.00
6,741.64
9.30
8.70
80.20
147
272
79.53
Law Enforcement Presence and Investment
The number of law enforcement personnel in the state of California actually increased 0.9 percent in 2014, however it remained 3.0 percent lower overall than in 2009. Since the recession of 2008, funding and staffing in most police departments throughout the state of California has actually gone down, significantly in some cases. This has led to mixed results, particularly in some of the small to mid-size cities. For example, in Anaheim both violent crime and property crime rose after their law enforcement personnel were reduced by close to 8 percent. In Santa Ana though, violent crime plunged by 24 percent after a modest reduction of 4 percent in their police staff.
There were three cities (Bakersfield, Irvine, and Richmond) that actually increased the size of their police departments, but two of them also saw spikes in property crime rates.
Hiring more police officers and boosting department budgets isn’t a panacea for all things crime related, but investment in law enforcement does help. Of course, how funds and officer man hours areif allocated can have a huge impact and that’s something that varies from city agency to city agency (even precinct to precinct). Focusing law enforcement efforts and budgets on the more serious offenses – such as violent crime – allows police departments to use their resources more effectively, thereby improving public safety.
Community Factors and Their Relationship with Crime
Poverty
The relationship between poverty rate and crime has been well established. Whether poverty causes crime or crime causes poverty is up for debate (and is debated often and hotly), the relationship between the two is not. The Bureau of Justice Statistics reports that, “persons living in poor households at or below the Federal Poverty Level had more than double the rate of violent victimization and a higher rate of firearm violence (as much as 4X higher) as persons in high-income households.” In California, the story is no different.
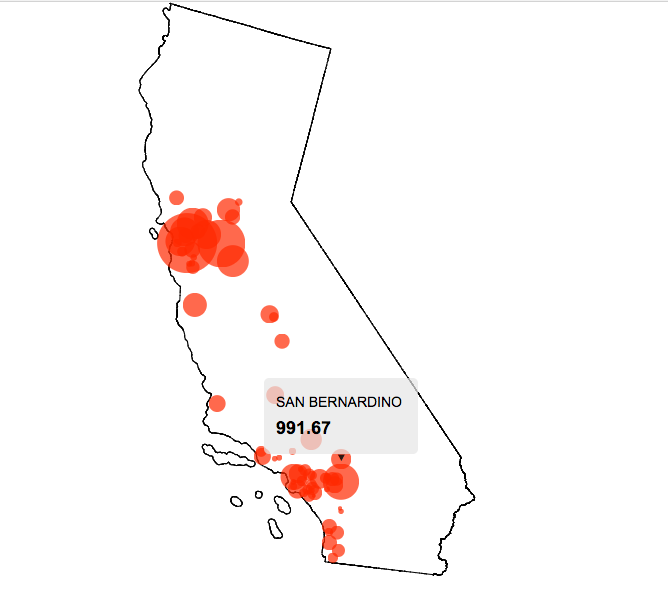
In taking a look at our collected data, no city in the bottom ten of crime rate (that is, had the lowest crime) had a poverty rate higher than 12.9 percent. But for cities in the top ten, every one had a poverty rate of 14.5 percent or higher, topping out at 30.6 percent in San Bernardino.
One explanation for high poverty levels in California cities could be the rising cost of living with stagnant wages. California did pass a bill approving $15/hour minimum wage, but this won’t take full effect for a few years. The poverty has actually grown in the state since 2007, and this could be because the increased cost of living is sending people into debt. It’s also encouraging people to leave or discouraging them from moving to the state.
Education
In our study we found moderate, significant negative correlations between crime and the percentage of high school graduates in a city, meaning that as the percentage of high school graduates dropped in the population, crime rates rose for certain types of crime. For example, such negative correlations were found between the percentage of high school graduates in CA cities and motor vehicle theft, murder, violent crime, aggravated assault, and robbery.
Other studies have shown that high school graduation rates have a big effect on crime. According to the School Library Journal, “dropouts are 3.5 times more likely to be arrested than high school graduates.” The ten most dangerous cities in our state all have a graduation rate of 83 percent or lower, bottoming out at 57 percent in Salinas. Conversely, in the study’s 10 safest cities for crime rate, their graduation rates are 81 percent or higher, with four such cities at 91 percent or higher.
The effects unemployment has on crime rate has been noted many times in national studies, and although the results of these studies are mixed, many show that unemployment has an effect on poverty, which has a significant effect on crime rates. The relationship between unemployment and poverty in California is clear – cities with higher rates of unemployment have higher rates of poverty. However, even when studied separately, researchers have found that unemployment correlates with crime. One such study found that a one percent increase in unemployment results in an increase in violent crime by 31.87 and property crime by 71.13 per 100,000 residents.
Population Density
It is well established that the volume of crime in an area depends heavily on population size. More people, more crime. However, total population has a much lower effect on crime rates. Researchers and experts have found that population density (in our study: the number of residents per square mile) has a much more measurable impact. According to a study by the Indiana University Public Policy Institute, the rates of murder, rape, robbery, and aggravated assault are typically higher in areas with high-density residential developments and commercial property, and lower in areas characterized by industry, parks, and schools.
Climate
It may sound arbitrary, but it’s true – even the FBI recognizes climate as a factor for determining dangerous areas. There have been several studies done that show a positive relationship between high temperatures and an increase in crime. The International Journal of Humanities and Social Sciences noted that, “It is evident that weather does impact crime. By studying current data and patterns of weather and crime, the outcome should show even more evidence of a correlation between weather and crime than ever before.”
What constitutes high temperature is relative, however. Some studies put the peak of this effect at 80 degrees, while others have that number in the low 90s. In order to cover all the recognized peaks, we counted up all the days that were 80 degrees or hotter in 2015 for each of the cities included in our research.
Methodology
We analyzed data across three key dimensions – Crime, Police Presence, and Community Factors. Within these dimensions, we identified and ranked 14 metrics that influence the safety of a city. Our dataset and rankings are a reflection of the following metrics:
Crime: 75 percent of total score
Overall Crime Rate per 100,000
Total Violent Crime Rate per 100,000
Murder and Homicide Rate per 100,000
Forcible Rape Rate per 100,000
Robbery Rate per 100,000
Aggravated Assault Rate per 100,000
Police Investment: 10 percent of total score
Police Officers per 100,000
Police Department Budget per Capita
Violent Crime Per Police Officer
Community Factors: 15 percent of total score
Poverty Rate
Unemployment Rate
Percentage of Residents Who Are High School Graduates
Climate – Number of days where temperature exceeded 80 degrees
Population Density – Number of residents per square mile
Data Sources
Crime data was sourced from the FBI’s Uniform Crime Reporting program and reflect data for 2014. All data was pulled from the “Offenses known to Law Enforcement” report.
Police department officer headcount and budget data was gathered from a combination of each city’s police department website, published city budgets, and phone calls/emails/tweets to each department.